The graph gives information about drinking habits of the US population by age. Summarize the information by selecting and reporting the main features, and make comparisons where relevant.
Write at least 150 words
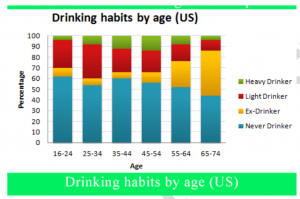
The bar chart shows information about people’s drinking behavior by age group in the US. Several trends are evident.
The highest proportion of those who never drink (nearby two-thirds) was in the 16 to 24 years group. The proportion tended to decrease with age. Only 40 percent of people aged 65 to 74 had never drink.
On the other hand, the percentage of those who had quit drinking tended to increase with age. Only 5 percent of those in the youngest age group (16 to 24) were ex-drinkers, as opposed to roughly 40 percent of those aged. 65 to 75.
The percentage of those classed as heavy drinkers also showed a distinct pattern. People in middle age (35 to 54) tended to be the heaviest drinkers – approximately 13 per cent of the total. A relative small proportion of those in the youngest age group, and an even smaller percentage of those in the oldest group (roughly 3 per cent) drink heavily.
Overall, age appears to be a significant factor in pattern of drinking behavior.
![]()
![]()